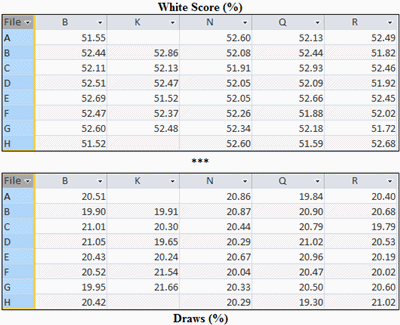
The following table shows the results. For example, Bishop starting on the a-file scores 51.55% for White overall and draws in 20.51% of the games.

Although the numbers look like statistical noise, a few patterns might be significant. According to the table, Bishops starting in the corner win less for White than when starting on other squares. Bishops on b/g-files draw less. Knights in the corner win more. Queens in the corner draw less.
Why only 'a good idea at the time'? I expected to see something more convincing.

No comments:
Post a Comment